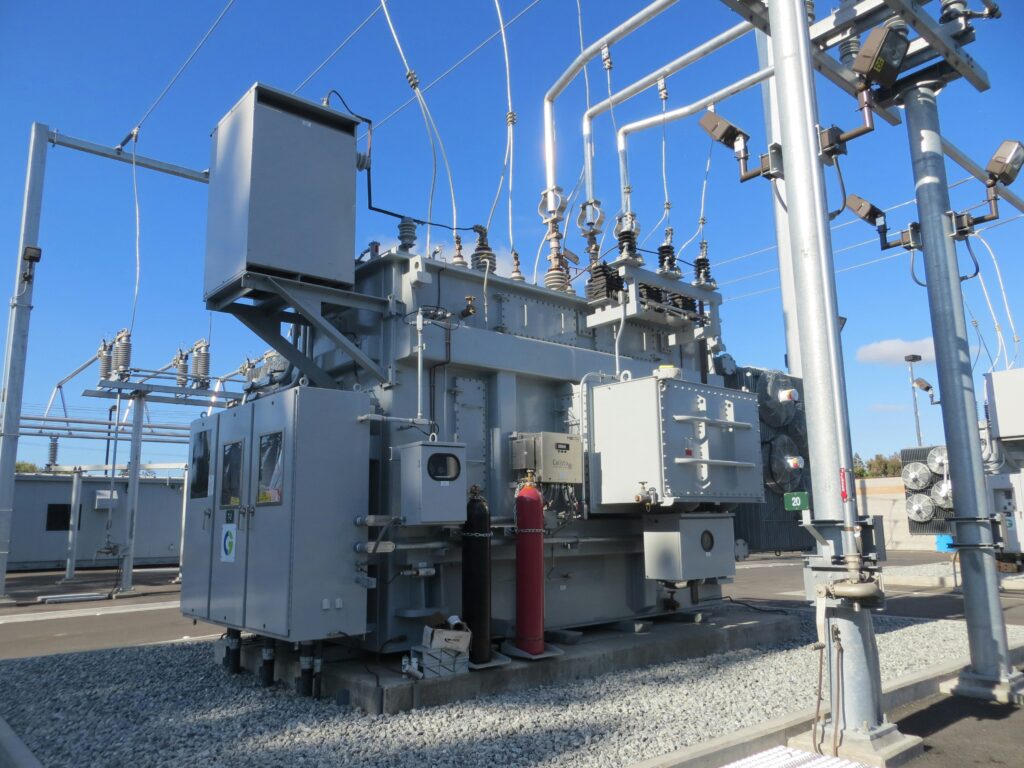
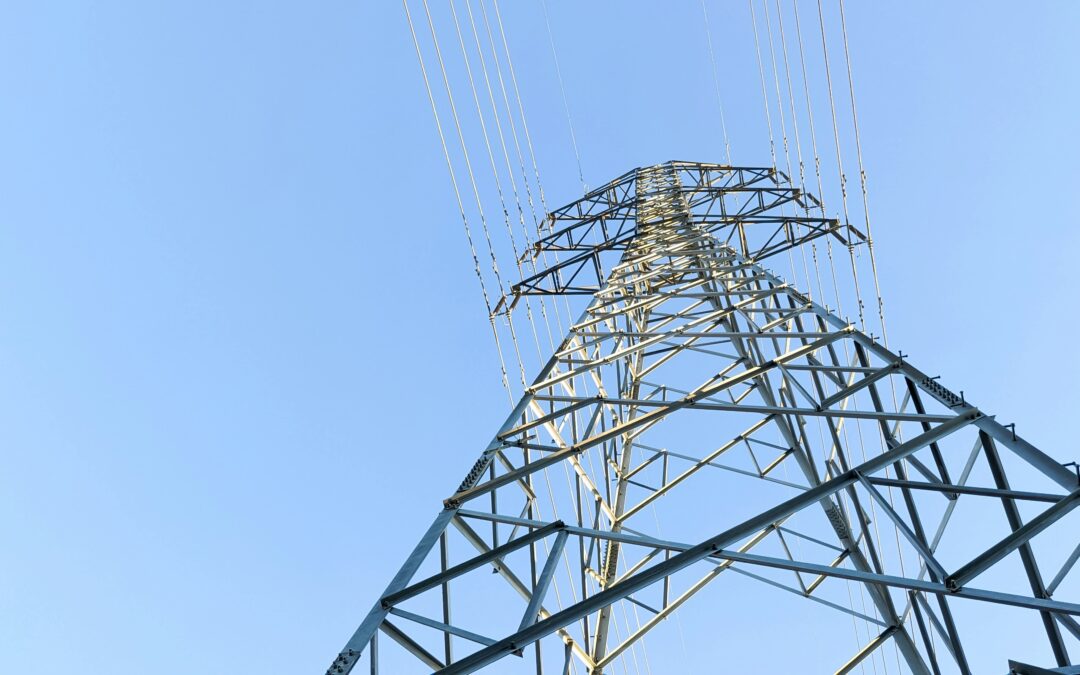
Media coverage constantly pits energy sources against each other—coal versus nuclear, gas versus renewables—in an endless tug-of-war. But this narrative misses a crucial reality: the fundamental challenge around the rising cost of electricity isn’t how we generate it, but how we deliver it from source to socket.
America’s Grid Receives a Failing Grade
The latest American Society of Civil Engineers (ASCE) infrastructure report card delivered sobering news: America’s electrical grid now merits only a D+ rating, a troubling decline from its previous C- in 2020. For context, this independent evaluation examines 18 categories of national infrastructure, with our electrical system showing one of the most concerning downward trends.
Consider this question: In your organization, would leadership accept a D+ performance rating in any critical function? Would a persistent decline in core metrics trigger immediate intervention? For most businesses, such underperformance would spark urgent action plans and accountability measures—yet collectively, we’ve allowed an essential part of our public infrastructure to deteriorate to unacceptable levels.
The ASCE report highlights: “Energy interruptions bear significant costs on U.S. industries and consumers, as even brief power outages increase production costs and disrupt supply chains.” This deterioration coincides with unprecedented demand growth. Data centers supporting AI applications are expected to reach 35 GW by 2030, more than doubling from 17 GW in 2022. Manufacturing expansion through reshoring initiatives continues to accelerate, while electrification spreads through transportation, heating, cooling and industrial processes at an unprecedented pace.
The Rising Cost of Electricity Phenomenon
Our comprehensive analysis of utility rate data reveals a dramatic shift in electricity cost trajectories beginning in 2020:
| Period | Average U.S. Commercial Rate Increase |
| 2016-2020 | 3.28% total (0.6% annually) |
| 2020-2024 | 22.86% total (5.14% annually) |
This represents more than a sevenfold acceleration in price increases. Regional variations are even more dramatic—California experienced a 72.33% rate increase from 2020-2024, compared to 16.3% during the preceding four-year period.
To further illustrate this trend, VECKTA analyzed regulatory rate cases from major utilities across the country. The data reveals a consistent pattern of accelerating transmission and distribution (T&D) infrastructure costs: PG&E in California saw annual T&D cost growth jump from 5% to 15% between pre- and post-2020 periods. Southern California Edison experienced similar acceleration, from 4% to 10%. This pattern extends well beyond California—ComEd in Illinois saw growth rates increase from 2% to 7%, while Duke Energy Carolinas jumped from 2.5% to 8.5%. Even utilities with more modest increases, like Arizona Public Service (1% to 2-3%) and Tucson Electric Power (2% to 4%), show the same upward trajectory.
These aren’t isolated cases—they represent a national pattern where the cost of just delivering electricity has significantly outpaced inflation, and in many regions now exceeds the cost of generating the electricity itself.
For example, in San Diego Gas & Electric territory, delivery costs now make up approximately 69% of residential bills, with actual energy generation accounting for just 31%. According to EIA data, the cost of electricity delivery increased 65% on an inflation-adjusted basis during 2010-2020, while generation costs remained relatively stable or declined. This pattern has only accelerated since 2020, with delivery infrastructure now comprising the majority of many consumers’ electricity bills.
This escalation is primarily an investor-owned utility phenomenon. These regulated natural monopolies earn returns by deploying capital into infrastructure rather than electricity generation itself. As grid hardening expenses that were deferred for decades come due, ratepayers are shouldering ever-increasing costs.

Utility Grid Modernization Efforts and Challenges
Utilities nationwide are pursuing comprehensive grid modernization programs, but these efforts come with significant price tags. PG&E has committed to burying 10,000 miles of power lines in high-risk areas at costs exceeding $20 billion. Similar undergrounding initiatives are underway with Southern California Edison, Duke Energy, and numerous other major utilities across the country.
Beyond undergrounding, utilities are investing in digital substations, smart switches, automated fault detection systems, and advanced grid management platforms. In 2023 alone, electric utilities requested a collective $13.51 billion in rate increases largely directed toward these modernization efforts. This included approximately $57 billion specifically for distribution infrastructure investments.
Resilience hardening represents another significant investment category. Utilities are enhancing physical infrastructure to withstand extreme weather by replacing wooden poles with composite materials, upgrading transmission towers, and implementing microgrids for critical facilities. Advanced distribution management systems featuring new software to optimize power flows and respond to outages more efficiently further add to these costs.
Despite these ambitious programs, utilities face formidable implementation challenges. Component shortages have become particularly acute for vital grid equipment. Transformer lead times now stretch beyond 120 weeks with prices 60-80% higher than 2020 levels. Meanwhile, workforce constraints intensify as experienced utility workers retire faster than replacements can be trained in specialized skills.
Regulatory and permitting processes further complicate modernization efforts, with approvals often extending project timelines by years. Perhaps most daunting is the funding gap—the current disparity between allocated resources and actual infrastructure needs stands at approximately $578 billion, a figure that continues to grow despite rate increases.
The Aging Infrastructure Crisis
The deteriorating state of our electrical infrastructure presents a stark reality. Distribution system failures now account for 92% of power interruptions nationwide. The aging transformer fleet averages over 40 years in service—well beyond the 25-year design life these critical components were engineered to sustain. Similarly, 60% of circuit breakers across the grid exceed 30 years of service, while 70% of transmission lines have operated for more than 25 years.
Climate vulnerability compounds these age-related challenges. Most distribution poles under 60 feet tall lack adequate engineering to withstand severe storms. During Hurricane Katrina and Superstorm Sandy, over 155,000 wooden distribution poles were destroyed. When Entergy rebuilt after Katrina, rate increases of 7.5% were implemented simply to cover infrastructure replacement costs. Concerningly, current building codes still permit replacement of failed poles with similarly vulnerable designs rather than requiring more resilient alternatives.
This infrastructure deterioration coincides with the planned retirement of 88 GW of conventional generation capacity by 2032, according to NERC estimates. While new generation resources—both renewable and conventional—stand ready to fill this gap, they face extended interconnection delays. Nearly 2,600 GW of generation and storage capacity currently awaits grid access through processes averaging 35 months for completion.

Quantifying Business Impact
Energy reliability directly impacts operational continuity across all sectors. Automotive manufacturing facilities face costs approaching $3 million per hour during outages. General manufacturing operations typically incur $260,000 hourly in direct costs, while healthcare facilities average $636,000 per hour. Retail operations face disruption costs of approximately $1.1 million hourly, telecommunications providers $2 million, and energy producers themselves $2.48 million.
Beyond complete outages, chronic power quality issues steadily erode equipment performance and longevity. Voltage fluctuations, harmonic distortion, and momentary interruptions cause cumulative damage that reduces equipment lifespans by approximately 7% annually—a hidden cost rarely captured in standard energy accounting.
For businesses evaluating expansion, the grid’s limitations now present structural barriers to growth. Many utilities quote 3-7 year timelines for infrastructure upgrades needed to support additional loads. These constraints effectively throttle economic development in regions where grid capacity has reached its limits, forcing businesses to delay growth or relocate operations.
The Business Case for Onsite Energy Systems
Forward-thinking organizations increasingly recognize onsite energy systems as strategic assets rather than mere sustainability initiatives. Commercial solar installations reached 535 MWdc in Q3 2024 alone, representing 44% year-over-year growth. Market analysts project the distributed energy sector will reach $68 billion annually by 2027, with energy storage integration accelerating to achieve 28% attachment rates with distributed solar by 2028.
These systems deliver multiple business advantages beyond environmental benefits. By generating electricity onsite, organizations establish predictable operational expenses by locking in energy costs for 20+ years, typically achieving 10-30% reductions compared to utility rates. Onsite generation coupled with storage provides enhanced operational reliability, maintaining critical functions during grid disruptions that would otherwise shut down operations.
Expansion capabilities represent another significant advantage. Onsite systems enable growth without waiting for utility infrastructure upgrades that may take years to complete. The competitive positioning aspect becomes increasingly important as energy cost disparities widen—U.S. energy prices currently average 14¢/kWh and continue rising, while international competitors like China pay just 9¢/kWh with projections suggesting further decreases to 7¢/kWh.
The financial performance of these systems has improved dramatically in recent years. With Investment Tax Credits and other incentives, many commercial systems achieve payback periods between 3-7 years with internal rates of return exceeding 15%. These investments frequently outperform traditional capital allocations while simultaneously reducing operational risk profiles.
Strategic Imperative for Business Leaders
The deteriorating state of electrical infrastructure represents both a threat and an opportunity for forward-thinking organizations. Grid transformation will require decades and trillions in investment, with uncertain outcomes and costs that will ultimately be borne by ratepayers. Meanwhile, businesses face immediate energy challenges that cannot wait for systemic solutions.
By developing onsite energy resources, organizations transition from passive ratepayers to active energy architects—gaining control over a critical operational input while improving bottom-line performance. The question isn’t whether businesses can afford to invest in energy self-sufficiency, but whether they can afford not to. As the gap between grid capacity and business needs widens, energy independence will increasingly separate industry leaders from laggards.
Sources and References:
American Society of Civil Engineers (ASCE). “2025 Infrastructure Report Card.” Released March 2025. The U.S. grid received a D+ rating, down from a C- in 2020.
Utility Dive. “US Energy Infrastructure Gets a D+ from American Society of Civil Engineers.” March 2025.
Energy Information Administration (EIA). “Grid Infrastructure Investments Drive Increase in Utility Spending over Last Two Decades.” 2024. T&D costs increased 65% on an inflation-adjusted basis from 2010-2020.
S&P Global. “US Power Transmission, Distribution Costs Seen Outpacing Electricity Production Costs.” November 2024.
Mark Z. Jacobson, Stanford University. Research published in PV Magazine, January 2025, demonstrates that high electricity prices in California are primarily due to T&D costs, not renewable energy generation.
VECKTA Analysis of financial filings and regulatory rate cases, showing T&D cost growth patterns across major utilities from 2016-2024.


